# Benchmarks
> Hello-world throughput of tako's two serving models against Axum, Actix Web, and ntex under loopback, server-bound, and pipelined load.
Hello-world throughput is not the whole story, but it shows whether the request
hot path leaves performance on the table. This page compares tako's two serving
models with Axum, Actix Web, and ntex under three loads in the same Linux
container.
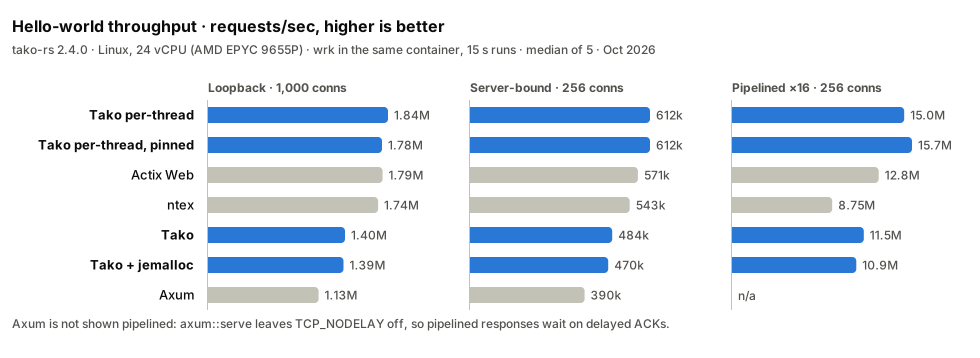
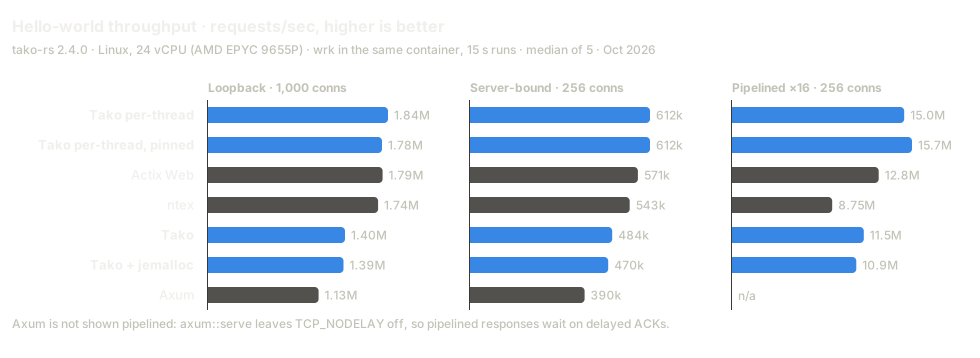 Measured on 2026-10-01 with tako-rs 2.4.0 in a Railway container: a 24 vCPU
quota on an AMD EPYC 9655P host, Linux 6.18, Rust 1.98.1, and `wrk` 4.1.0.
## Three loads
* **Loopback.** 12 server workers and 12 `wrk` threads share the CPU quota, and
each connection sends one request at a time. Kernel time for the loopback TCP
traffic takes about 5 µs of the roughly 6 µs of server CPU per request, so the
thread-per-core servers land close together.
* **Server-bound.** 4 server workers face 16 `wrk` threads. The server runs out
of CPU first, so its cost per request decides the result.
* **Pipelined.** `wrk` writes 16 requests at a time on each connection, as in
the TechEmpower plaintext test. Each syscall serves up to 16 requests, so the
framework's own work dominates.
## Results
Requests per second are the median of five 15-second runs. CPU per request is
the server's user plus system time divided by the requests it served. Spread is
half the range of the five runs, relative to the median. No run recorded a
socket error or a non-2xx response.
Against tako-rs 2.3.0 in the same run, each with its default settings, the
default server serves 20% more requests at 1,000 connections, 21% more
server-bound, and 53% more pipelined; the per-thread server serves 9% more
server-bound and 30% more pipelined.
### Loopback, 100 connections
| Framework | Requests/sec | p50 | p99 | CPU per request | Spread |
| --------------------------- | -----------: | ------: | ------: | --------------: | -----: |
| **Tako per-thread** | 1,791,799 | 0.04 ms | 0.80 ms | 6.09 µs | ±1.7% |
| Actix Web | 1,730,462 | 0.04 ms | 2.78 ms | 6.42 µs | ±3.2% |
| **Tako per-thread, pinned** | 1,729,861 | 0.04 ms | 2.15 ms | 6.13 µs | ±8.0% |
| ntex | 1,668,935 | 0.05 ms | 1.08 ms | 6.97 µs | ±4.8% |
| **Tako + jemalloc** | 567,643 | 0.14 ms | 0.94 ms | 9.23 µs | ±8.3% |
| **Tako** | 553,666 | 0.15 ms | 0.90 ms | 9.08 µs | ±11.7% |
| Axum | 528,781 | 0.16 ms | 1.03 ms | 11.28 µs | ±6.4% |
### Loopback, 1,000 connections
| Framework | Requests/sec | p50 | p99 | CPU per request | Spread |
| --------------------------- | -----------: | ------: | ------: | --------------: | -----: |
| **Tako per-thread** | 1,842,063 | 0.26 ms | 1.24 ms | 5.93 µs | ±4.6% |
| Actix Web | 1,786,640 | 0.43 ms | 3.02 ms | 6.32 µs | ±2.7% |
| **Tako per-thread, pinned** | 1,780,810 | 0.27 ms | 3.38 ms | 6.06 µs | ±4.9% |
| ntex | 1,740,750 | 0.52 ms | 1.96 ms | 6.67 µs | ±2.6% |
| **Tako** | 1,401,625 | 0.61 ms | 1.96 ms | 7.58 µs | ±4.6% |
| **Tako + jemalloc** | 1,386,954 | 0.62 ms | 2.16 ms | 7.79 µs | ±3.7% |
| Axum | 1,132,259 | 0.76 ms | 2.57 ms | 10.10 µs | ±6.1% |
### Server-bound, 256 connections
| Framework | Requests/sec | p50 | p99 | CPU per request | Spread |
| --------------------------- | -----------: | ------: | ------: | --------------: | -----: |
| **Tako per-thread** | 612,091 | 0.40 ms | 1.47 ms | 6.42 µs | ±1.1% |
| **Tako per-thread, pinned** | 611,956 | 0.40 ms | 1.53 ms | 6.44 µs | ±1.9% |
| Actix Web | 570,865 | 0.42 ms | 1.66 ms | 6.84 µs | ±1.9% |
| ntex | 543,076 | 0.45 ms | 1.53 ms | 7.20 µs | ±2.9% |
| **Tako** | 483,526 | 0.50 ms | 1.40 ms | 7.90 µs | ±2.8% |
| **Tako + jemalloc** | 469,807 | 0.52 ms | 2.21 ms | 8.13 µs | ±3.6% |
| Axum | 389,844 | 0.64 ms | 1.50 ms | 9.95 µs | ±1.8% |
### Pipelined, 256 connections
| Framework | Requests/sec | CPU per request | Spread |
| --------------------------- | -----------: | --------------: | -----: |
| **Tako per-thread, pinned** | 15,716,822 | 0.75 µs | ±5.9% |
| **Tako per-thread** | 15,033,668 | 0.77 µs | ±3.8% |
| Actix Web | 12,806,477 | 0.90 µs | ±3.4% |
| **Tako** | 11,512,467 | 0.91 µs | ±8.5% |
| **Tako + jemalloc** | 10,853,271 | 0.97 µs | ±8.0% |
| ntex | 8,749,294 | 1.31 µs | ±3.9% |
With 16 requests per write, `wrk` records one latency per batch, so this table
leaves latency out. Axum is left out too: `axum::serve` leaves `TCP_NODELAY`
off, so pipelined responses wait on delayed ACKs, and it served 88,398 requests
per second. Turning nodelay on through axum's `ListenerExt::tap_io` avoids that.
## Two serving models
The default server, `Server::builder()`, runs on Tokio's multi-threaded,
work-stealing runtime, the same model as Axum. It serves about 24% more
requests than Axum at 1,000 connections and when the server is the bottleneck,
because it spends less CPU on each request: 7.6 µs against 10.1 µs at 1,000
connections. At 100 connections the two land within 5% of each other.
Since 2.4 a hello-world request does not allocate, so jemalloc no longer pulls
ahead: **Tako + jemalloc** lands between 3% above and 6% below **Tako**. It can
still pay off for handlers that allocate; see
[Deployment](/docs/deployment#single-binary-the-default).
The `per-thread` feature runs one current-thread Tokio runtime per worker, each
with its own `SO_REUSEPORT` listener. It hands each new connection to the
worker with the fewest live connections, and the connection then stays on that
worker, so requests never cross threads. Actix Web and ntex use the same shape.
Tako per-thread serves about 3% more requests than Actix Web on loopback, 7%
more when the server is the bottleneck, and 17% more pipelined.
The **Tako per-thread, pinned** rows turn on `pin_to_core`, which pins each
worker to a CPU core and is off by default. Pinning gained about 5% pipelined,
made no difference server-bound, and cost about 3% on loopback with a longer
latency tail, because pinned workers compete with the co-located `wrk` threads
for their cores. Every process pins from core 0, so turn it on only when the
server has the machine to itself.
Per-thread workers serve HTTP/1.1; TLS, h2c, and PROXY listeners use the
regular server builder. The kernel balances connections across `SO_REUSEPORT`
listeners only on Linux, so measure per-thread throughput there. See
[Thread-per-core](/docs/deployment#thread-per-core) for the entry points.
The Compio flavour (`per-thread-compio`) is not in the tables: the container
blocks io\_uring, so its runtime cannot start there.
## Methodology
* **Servers.** Each framework serves `GET /` → `Hello, World!` from a minimal
release binary (`lto = "fat"`, `codegen-units = 1`) with its default
settings; every response is the same 130 bytes. Versions: tako-rs 2.4.0,
axum 0.8.9, actix-web 4.15.0, ntex 3.12.3, tokio 1.53.1.
* **Load.** `wrk` runs in the same container and connects over loopback. The
loopback and pipelined loads split the 24 vCPU quota into 12 server workers
and 12 `wrk` threads; the server-bound load gives the server 4 workers and
`wrk` 16 threads. For the pipelined load, a Lua script makes `wrk` write 16
requests at a time:
```lua
init = function(args)
local batch = {}
for i = 1, 16 do batch[i] = wrk.format(nil, "/") end
req = table.concat(batch)
end
request = function() return req end
```
* **Runs.** Each measurement is a 3-second warm-up followed by a 15-second
`wrk --latency` run. Five rounds rotate the server order, and the tables
report medians.
* **CPU.** The server's user and system time come from `/proc//stat`,
read before and after each run.
* **jemalloc.** The `jemalloc` feature only re-exports the allocator; the
benchmark binary installs it:
```rust
#[global_allocator]
static GLOBAL: tako::Jemalloc = tako::Jemalloc;
```
## Caveats
These are **baselines, not universal claims**. The container shares its host
with other tenants, the load generator shares the CPU quota with the server,
and loopback removes the real network. A hello-world route isolates the request
hot path; application logic, TLS, and payload size change the picture.
Reproduce on your own hardware before drawing conclusions.
## Reproducing locally
The default server is
[`examples/hello-world`](https://github.com/rust-dd/tako/tree/main/examples/hello-world):
```bash
cargo run --release --manifest-path examples/hello-world/Cargo.toml
# in another terminal:
wrk -t4 -c100 -d15s --latency http://127.0.0.1:8080/
```
Save the Lua script above as `pipeline.lua` to repeat the pipelined load:
```bash
wrk -t4 -c256 -d15s -s pipeline.lua http://127.0.0.1:8080/
```
For the per-thread server, use
[`examples/bench-pt`](https://github.com/rust-dd/tako/tree/main/examples/bench-pt)
on Linux. It takes the mode, the address, and the worker count:
```bash
cargo run --release --manifest-path examples/bench-pt/Cargo.toml -- pt-tokio 127.0.0.1:8080 4
```
`bench-pt` counts requests for its load-distribution report, so expect it to
land somewhat below the numbers above.
Source: https://tako.rust-dd.com/docs/benchmarks